Media kit
Press
Organization copy, Index highlights, and downloadable charts for reporters. Cost figures stay sourced. Gaps stay gaps.
Organization boilerplate
Longer version: About ElderCareCosts. Money model: How we make money.
For journalists
We hold data most of this category does not publish: licensed provider records pulled from state registries and CMS, federal inspection citations, a documented cost model with its survey vintage on every figure, county income and housing figures, and published wage data. If you are working on a story about senior care cost, access, ownership, or oversight, you can have any of it.
What is available
- The data newsroom. Original analysis of care deserts, the affordability gap, inspection severity patterns, the caregiver wage gap, year over year cost movement, ownership concentration, and the Medicaid caregiver-pay patchwork. Every piece carries a chart, the full table, a downloadable CSV, and a section on what the analysis cannot tell you.
- Per-metro packs on request. Tell us the city and we will send a fact sheet, a CSV, and a city against state against national chart.
- A CSV behind every cost table on the site, and the raw source list on Data sources.
- The method behind every modeled figure on Methodology, including the hours basis and survey vintage each cost carries.
Citation policy
- Reuse our figures with attribution. No permission needed, no licence to sign, no embargo. Credit ElderCareCosts Research and link to the page you took the number from.
- Every data page carries a copyable citation sentence with the source, the as-of date, and the URL. Use it verbatim and the provenance travels with the number.
- Quote the figure with its basis. A monthly median for in-home care means nothing without the weekly hours it assumes, and we print those together for exactly that reason.
- Inspection and deficiency data is a record of what surveyors documented, not a quality score. We do not rank facilities on it and we ask that stories using it do not either.
- If we get something wrong, tell us and we will correct it and say so. Our corrections policy is public.
Ask us
Email [email protected] with the cut you need. A city, a state, a care type, a date range, or a question about how a figure was built. We will send the data and the method behind it, and if the data cannot answer your question we will say that instead of estimating.
For site owners
If you run an Area Agency on Aging page, an elder-law blog, or a hospital discharge resource, you can embed our cost data directly. Free embeddable widgets for city cost tables, city-versus-state-versus-national comparisons, provider counts, and care-type cost cards. No sign-up, no tracking of your visitors, and the number stays current on its own.
The ElderCareCosts 2026 Cost of Senior Care Index: highlights
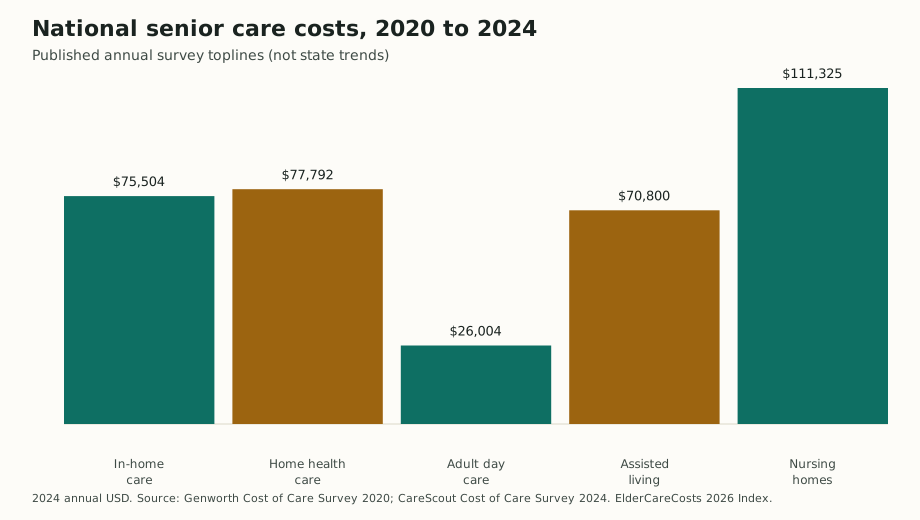
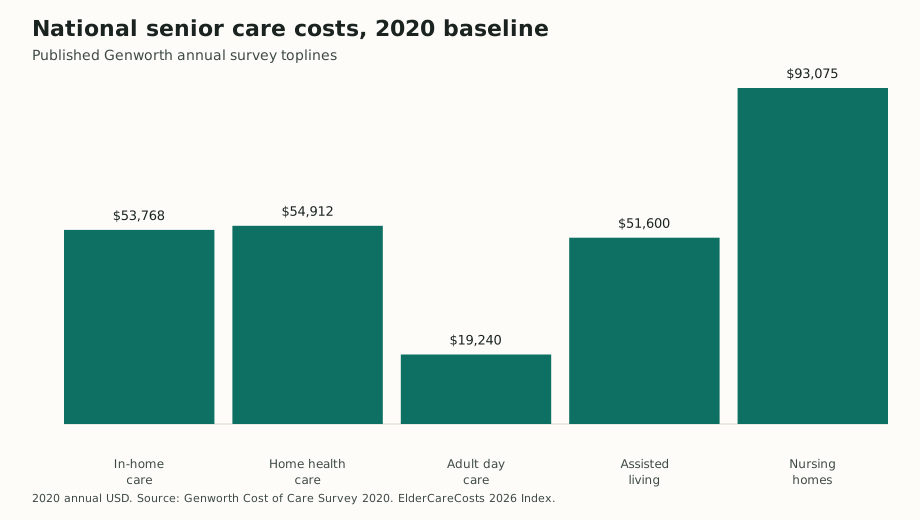
Four-year national change uses published Genworth (2020) and CareScout (2024) survey toplines. Monthly medians come from published state cost records when enough states report. This is not a state-by-state trend table.
| Care type | 2020 annual | 2024 annual | Change | Our monthly median |
|---|---|---|---|---|
| In-Home Care | $53,768 | $75,504 | +40.4% | $6,769 |
| Home Health Care | $54,912 | $77,792 | +41.7% | $6,769 |
| Adult Day Care | $19,240 | $26,004 | +35.2% | $2,058 |
| Assisted Living | $51,600 | $70,800 | +37.2% | $6,230 |
| Nursing Homes | $93,075 | $111,325 | +19.6% | $10,205 |
Full tables and CSV: 2026 Cost of Senior Care Index.
Downloadable charts
SVG charts for stories and social. Credit ElderCareCosts Research. Source lines are printed on each file.
National senior care costs, 2024
Download SVGPublished CareScout 2024 annual survey toplines by care type. Not a state trend.
National senior care costs, 2020 baseline
Download SVGPublished Genworth 2020 annual survey toplines by care type.
Per-metro data cuts
Covering a specific metro? We prepare a local data pack on request: a fact sheet, CSV, a city-vs-state chart, boilerplate, and attribution guidance. Email us the metro and your deadline.
Press release
The 2026 Index launch release is available for review.
Media contact
Email [email protected]. Ask for a metro pack by city name. We will not invent a figure that is not in the published record.